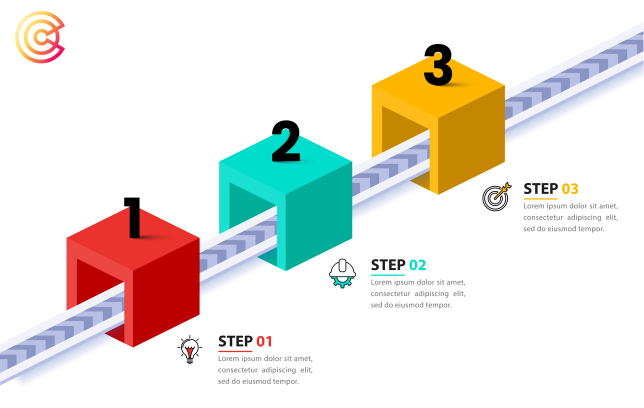
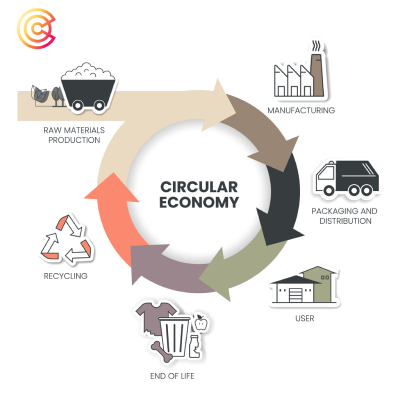
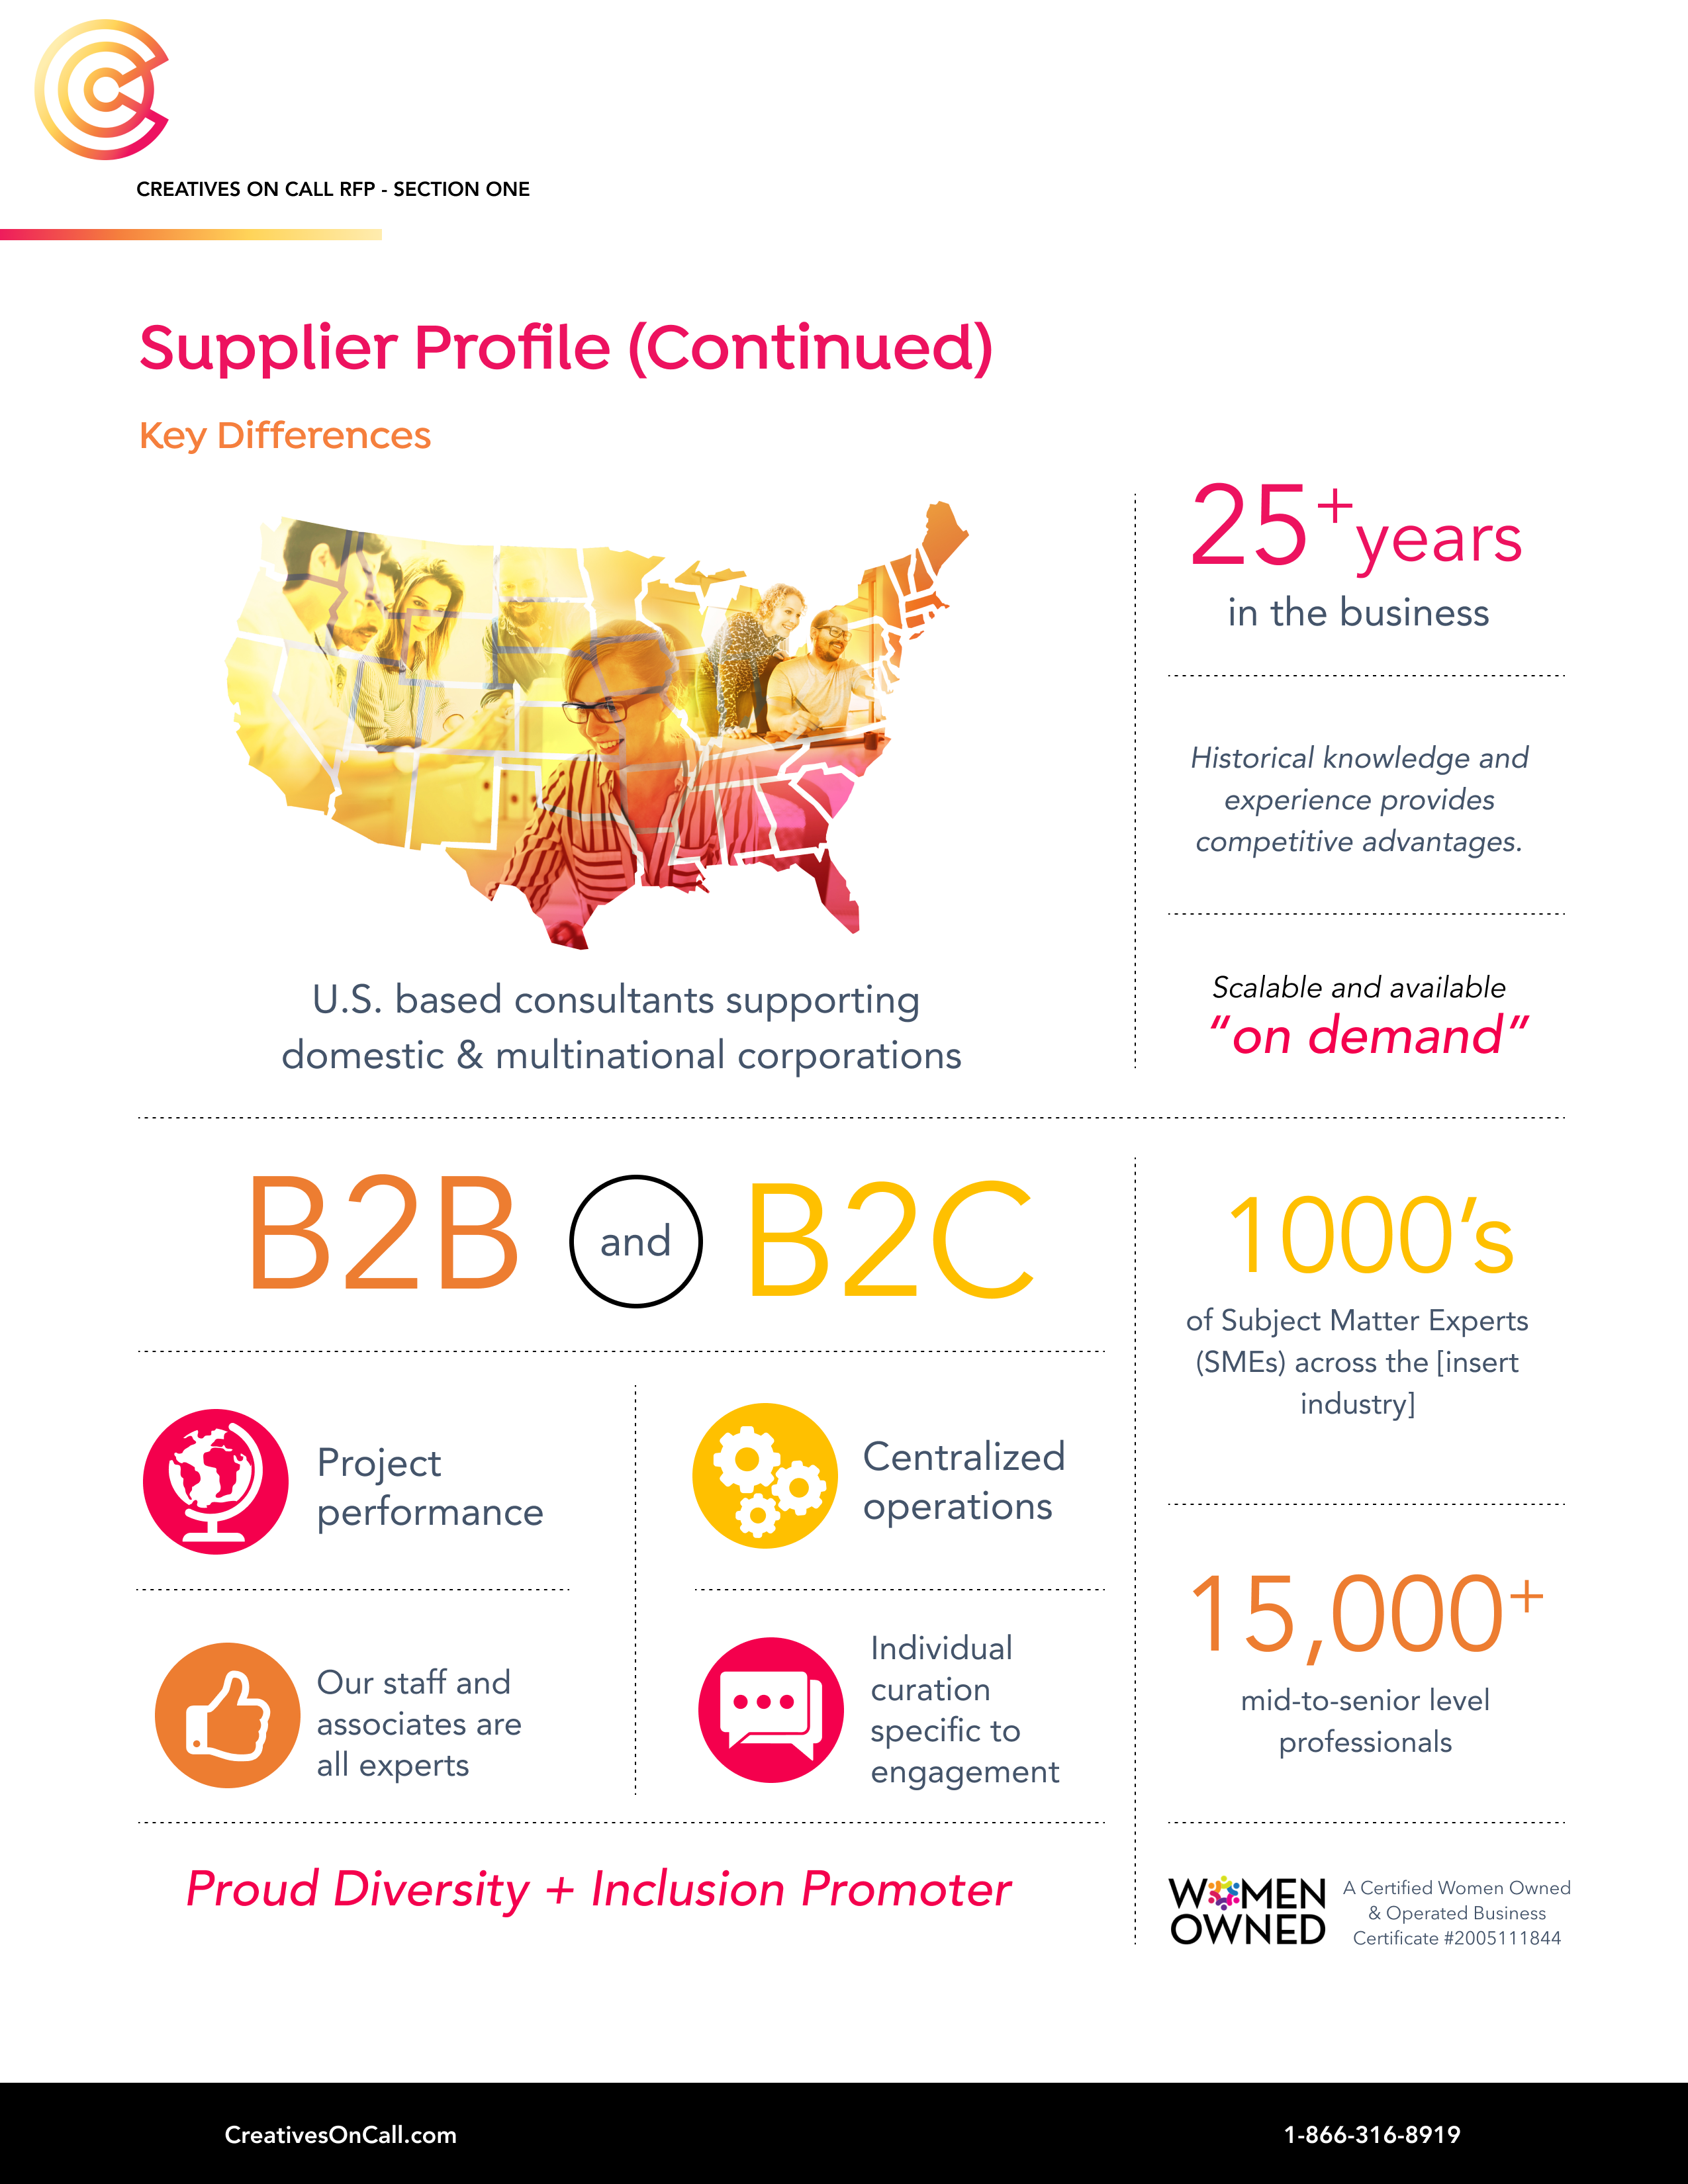
Infographics use data visualizations, minimal text and striking graphics to communicate information quickly and clearly. For manufacturing companies overloaded with detailed statistics and multifaceted processes, infographics provide an ideal way to organize and share key data with both internal teams and external audiences.
When infographics are designed effectively using best practices, they enhance comprehension, improve recall and prompt action among viewers. They can also integrate seamlessly with other manufacturing digital marketing services.
When you partner with the expert designers at Creatives On Call, you can leverage the power of infographics with other marketing strategies to drive growth.
What Is an Infographic?
An infographic is a visual image such as a chart, diagram or illustration representing information or data.
Infographics condense complicated information into easily digestible graphical formats using key elements.
VisualizationsGraphs, maps, timelines |
 |
ImagesPhotos, icons, illustrations |
|
Minimal TextHeaders, labels, captions |
 |
Color SchemeBrand colors or a cohesive palette |
 |
By combining these features into a coordinated visual story, infographics turn complex statistics and processes into simplified snapshots.
Key Uses & Benefits
Infographics are useful for manufacturing organizations struggling to compile endless data into usable formats. Specific applications include:
Conveying Company Statistics
Dashboards with crucial key performance indicators (KPIs) like safety metrics, quality rates, operational efficiency, sales volumes and more are translated into charts/graphs rather than endless spreadsheets.
Demonstrating Manufacturing Processes
Complex assembly line or supply chain workflows are simplified through flow charts, diagrams and annotated illustrations. This is especially effective for training.
Highlighting Safety Best Practices
Workplace safety guidelines, hazards, emergency response procedures and proper equipment usage are reinforced visually through infographics provided in training manuals, on signage or in employee communications.
Comparing Product Lines
Product features, specifications, dimensions, configurations, options and accessories are displayed side-by-side for easy differentiation. This is useful for both internal teams and customer-facing content.
Mapping Supply Chain Relationships
Multi-tiered partner networks are visualized through tree maps or relationship diagrams that trace all upstream and downstream connections.
Simplifying Complex Topics
Data-intensive subject matter like advanced manufacturing techniques, quality management frameworks, industrial automation and more are transformed into more accessible formats.
Infographic Design Best Practices
Effective infographic design requires finding the optimal balance between visual impact and clear communication. At Creatives On Call, our teams follow best practices for infographic design to ensure you get the best return on investment (ROI) on this service. Some key design principles include:
- Keep it simple: We understand that the most successful infographics have a specific focus with a single key message or data snapshot rather than too many intricate details.
- Use accurate data: Our teams help carefully vet all statistics, facts, figures and other data points included to ensure credibility and precision.
- Establish visual hierarchy: Our teams use layout, color, size, contrast and other design elements to guide the viewer’s eyes through the predetermined flow of information.
- Stick with a color scheme: We know how to strategically use your brand colors to connect graphics, align related information and highlight patterns in the data.
- Use cohesive imagery: We understand the importance of infusing industry-specific photos, logos, custom icons and illustrations relevant to the content to enhance engagement.
- Write concise text: With help from our expert copywriters, we work to use brief titles, labels and captions to annotate and enhance graphics as needed.
Integrating Infographics Into Your Marketing Strategy
Even though they’re powerful on their own, infographics reach their full potential as part of a cohesive manufacturing marketing strategy that encompasses complementary services. At Creatives On Call, we offer a suite of creative and marketing services to deliver an integrated approach. From manufacturing goal identification to experiential research, we have the offerings you need to grow your business.
Some of our manufacturing marketing services include:
- Skilled copywriters who can turn your data visualizations into compelling content assets like blog posts, social media updates and sales enablement materials.
- Web developers who can embed dynamic interactive infographics into product pages or section headers, which allows visitors to filter and customize views.
- Dedicated pay-per-click (PPC) and social media advertising managers who can maximize visibility and drive targeted traffic to infographic content.
- Video developers who can animate engaging explainers that bring your key data points and manufacturing processes to life. We can extend our reach further by repurposing these motion graphics into online ads and trade show booth displays.
Whatever creative team we build for you at Creatives On Call, we ensure your brand guidelines and visual identity carry through all assets consistently. Infographics are more effective when developed as integrated components into omnichannel campaigns aligned under one unified brand strategy. The synergistic approach increases exposure, amplifies messaging, provides wider access to complex data and ultimately drives greater ROI across the entire marketing scope.
Connect With Manufacturing Marketing Experts Through Creatives On Call
Drive Manufacturing Marketing With Creatives On Call
Infographics won’t replace traditional reports and data analysis entirely, but introducing them into your internal communications and marketing content provides significant value. Well-designed infographics enhance information delivery to diverse audiences through simplified, visual storytelling.
If your business is looking for all-in-one manufacturing marketing solutions that harness skills like design, content creation and web development, look to Creatives On Call. We are an industry-leading marketing and creative consultancy specializing in helping businesses solve marketing and communications challenges.
While we believe digital marketing should be an ongoing, coordinated effort, we can also connect you with experts for single projects. Using our network of creative consultants, we can build your dream team for manufacturing digital marketing. Wherever you are in your marketing journey, we are here to meet you and get to work.
Contact us today to get started.
Frequently Asked Questions
What types of data should you include in a manufacturing infographic?
Manufacturing infographics designed for internal use commonly include operational statistics like safety rates, quality scores, productivity metrics, compliance percentages and financial KPIs. Customer-facing infographics typically demonstrate capabilities, quality certifications, machining accuracy, testing processes, supply chain scale and manufacturing expertise.
What makes a good manufacturing infographic?
Good manufacturing infographics simplify complex information through easy-to-understand visualizations that adhere to design best practices. The designers at Creatives On Call implement relatable industry imagery and color strategically, establish a clear data hierarchy and incorporate just enough supporting text to annotate the graphical data story.
Can infographics improve manufacturing productivity?
Yes. The team at Creatives On Call understands that well-designed infographics improve knowledge sharing and data accessibility across an organization. Streamlining key statistics, workflows, production milestones and training content into graphical formats enhances engagement, recall and application, which directly translates to productivity gains over text-heavy reports alone.
